
TCPdump
Tcpdump
Tcpdump1 is a text-based network sniffer that is streamlined, powerful, and flexible despite the lack of a graphical interface. It is by far the most commonly-used command-line packet analyzer and can be found on most Unix and Linux operating systems, but local user permissions determine the ability to capture network traffic.
Tcpdump can both capture traffic from the network and read existing capture files. Let's look at what happened in the password_cracking_filtered.pcap file,2 which was captured on a firewall. Download the file and follow along as we analyze the data. First, we will launch tcpdump with sudo (to grant capture permissions) and open the file with the -r option:
kali@kali:~$ sudo tcpdump -r password_cracking_filtered.pcap
reading from file password_cracking_filtered.pcap, link-type EN10MB (Ethernet)
08:51:20.800917 IP 208.68.234.99.60509 > 172.16.40.10.81: Flags [S], seq 1855084074, win 14600, options [mss 1460,sackOK,TS val 25538253 ecr 0,nop,wscale 7], length 0
08:51:20.800953 IP 172.16.40.10.81 > 208.68.234.99.60509: Flags [S.], seq 4166855389, ack 1855084075, win 14480, options [mss 1460,sackOK,TS val 71430591 ecr 25538253,nop,wscale 4], length 0
08:51:20.801023 IP 208.68.234.99.60509 > 172.16.40.10.81: Flags [S], seq 1855084074, win 14600, options [mss 1460,sackOK,TS val 25538253 ecr 0,nop,wscale 7], length 0
08:51:20.801030 IP 172.16.40.10.81 > 208.68.234.99.60509: Flags [S.], seq 4166855389, ack 1855084075, win 14480, options [mss 1460,sackOK,TS val 71430591 ecr 25538253,nop,wscale 4], length 0
08:51:20.801048 IP 208.68.234.99.60509 > 172.16.40.10.81: Flags [S], seq 1855084074, win 14600, options [mss 1460,sackOK,TS val 25538253 ecr 0,nop,wscale 7], length 0
08:51:20.801051 IP 172.16.40.10.81 > 208.68.234.99.60509: Flags [S.], seq 4166855389, ack 1855084075, win 14480, options [mss 1460,sackOK,TS val 71430591 ecr 25538253,nop,wscale 4], length 0
...
Filtering Traffic
The output is a bit overwhelming at first, so let's try to get a better understanding of the IP addresses and ports involved by using awk and sort.
First, we will use the -n option to skip DNS name lookups and -r to read from our packet capture file. Then, we can pipe the output into awk, printing the destination IP address and port (the third space-separated field) and pipe it again to sort and uniq -c to sort and count the number of times the field appears in the capture, respectively. Lastly we use head to only display the first 10 lines of the output:
kali@kali:~$ sudo tcpdump -n -r password_cracking_filtered.pcap | awk -F" " '{print $5}' | sort | uniq -c | head
  20164 172.16.40.10.81:
     14 208.68.234.99.32768:
     14 208.68.234.99.32769:
      6 208.68.234.99.32770:
     14 208.68.234.99.32771:
      6 208.68.234.99.32772:
      6 208.68.234.99.32773:
     15 208.68.234.99.32774:
     12 208.68.234.99.32775:
      6 208.68.234.99.32776:
...
We can see that 172.16.40.10 was the most common destination address followed by 208.68.234.99. Given that 172.16.40.10 was contacted on a low destination port (81) and 208.68.234.99 was contacted on high destination ports, we can rightly assume that the former is a server and the latter is a client.
We could also safely assume that the client address made many requests against the server, but in order to proceed without too many assumptions, we can use filters to inspect the traffic more closely.
In order to filter from the command line, we will use the source host (src host) and destination host (dst host) filters to output only source and destination traffic respectively. We can also filter by port number (-n port 81) to show both source and destination traffic against port 81. Let's try those filters now:
sudo tcpdump -n src host 172.16.40.10 -r password_cracking_filtered.pcap
...
08:51:20.801051 IP 172.16.40.10.81 > 208.68.234.99.60509: Flags [S.], seq 4166855389, ack 1855084075, win 14480, options [mss 1460,sackOK,TS val 71430591 ecr 25538253,nop,wscale 4], length 0
08:51:20.802053 IP 172.16.40.10.81 > 208.68.234.99.60509: Flags [.], ack 89, win 905, options [nop,nop,TS val 71430591 ecr 25538253], length 0
...
sudo tcpdump -n dst host 172.16.40.10 -r password_cracking_filtered.pcap
...
08:51:20.801048 IP 208.68.234.99.60509 > 172.16.40.10.81: Flags [S], seq 1855084074, win 14600, options [mss 1460,sackOK,TS val 25538253 ecr 0,nop,wscale 7], length 0
08:51:20.802026 IP 208.68.234.99.60509 > 172.16.40.10.81: Flags [.], ack 4166855390, win 115, options [nop,nop,TS val 25538253 ecr 71430591], length 0
...
sudo tcpdump -n port 81 -r password_cracking_filtered.pcap
...
08:51:20.800917 IP 208.68.234.99.60509 > 172.16.40.10.81: Flags [S], seq 1855084074, win 14600, options [mss 1460,sackOK,TS val 25538253 ecr 0,nop,wscale 7], length 0
08:51:20.800953 IP 172.16.40.10.81 > 208.68.234.99.60509: Flags [S.], seq 4166855389, ack 1855084075, win 14480, options [mss 1460,sackOK,TS val 71430591 ecr 25538253,nop,wscale 4], length 0
...
We could continue to process this filtered output with various command-line utilities like awk and grep, but let's move along and actually inspect some packets in more detail to see what kind of details we can uncover.
To dump the captured traffic, we will use the -X option to print the packet data in both HEX and ASCII1 format:
kali@kali:~$ sudo tcpdump -nX -r password_cracking_filtered.pcap
...
08:51:25.043062 IP 208.68.234.99.33313 > 172.16.40.10.81: Flags [P.], seq 1:140, ack 1
  0x0000:  4500 00bf 158c 4000 3906 9cea d044 ea63  E.....@.9....D.c
  0x0010:  ac10 280a 8221 0051 a726 a77c 6fd8 ee8a  ..(..!.Q.&.|o...
  0x0020:  8018 0073 1c76 0000 0101 080a 0185 b2f2  ...s.v..........
  0x0030:  0441 f5e3 4745 5420 2f2f 6164 6d69 6e20  .A..GET.//admin.
  0x0040:  4854 5450 2f31 2e31 0d0a 486f 7374 3a20  HTTP/1.1..Host:.
  0x0050:  6164 6d69 6e2e 6d65 6761 636f 7270 6f6e  admin.megacorpon
  0x0060:  652e 636f 6d3a 3831 0d0a 5573 6572 2d41  e.com:81..User-A
  0x0070:  6765 6e74 3a20 5465 6820 466f 7265 7374  gent:.Teh.Forest
  0x0080:  204c 6f62 7374 6572 0d0a 4175 7468 6f72  .Lobster..Author
  0x0090:  697a 6174 696f 6e3a 2042 6173 6963 2059  ization:.Basic.Y
  0x00a0:  5752 7461 5734 3662 6d46 7562 3352 6c59  WRtaW46bmFub3RlY
  0x00b0:  3268 7562 3278 765a 336b 780d 0a0d 0a    2hub2xvZ3kx....
...
We immediately notice that the traffic to 172.16.40.10 on port 81 looks like HTTP data. In fact, it seems like these HTTP requests contain Basic HTTP Authentication data, with the User agent "Teh Forest Lobster". This is a pretty clear sign that something strange is occurring.
In order to uncover the rest of the mystery, we will need to rely on advanced header filtering.
Advanced Header Filtering
At this point, to better inspect the requests and responses in the dump, we would like to filter out and display only the data packets. To do this, we will look for packets that have the PSH and ACK flags turned on. All packets sent and received after the initial 3-way handshake will have the ACK flag set. The PSH flag1 is used to enforce immediate delivery of a packet and is commonly used in interactive Application Layer protocols to avoid buffering.
The following diagram depicts the TCP header and shows that the TCP flags are defined starting from the 14th byte.
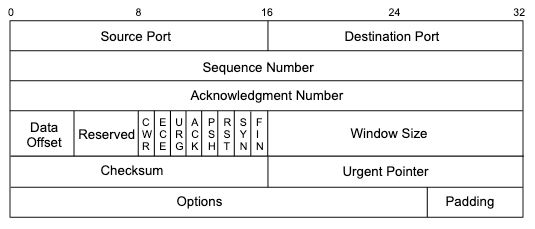
Looking at Figure 9, we can see that ACK and PSH are represented by the fourth and fifth bits of the 14th byte, respectively:
CEUAPRSF
WCRCSSYI
REGKHTNN
00011000  = 24 in decimal
Turning on only these bits would give us 00011000, or decimal 24.
kali@kali:~$ echo "$((2#00011000))"
24
We can pass this number to tcpdump with 'tcp[13] = 24' as a display filter to indicate that we only want to see packets with the ACK and PSH bits set ("data packets") as represented by the fourth and fifth bits (24) of the 14th byte of the TCP header. Bear in mind, the tcpdump array index used for counting the bytes starts at zero, so the syntax should be (tcp[13]).
The combination of these two flags will hopefully show us only the HTTP requests and responses data. Here's the command we'll use to display packets that have the ACK or PSH flags set:
kali@kali:~$ sudo tcpdump -A -n 'tcp[13] = 24' -r password_cracking_filtered.pcap
06:51:20.802032 IP 208.68.234.99.60509 > 172.16.40.10.81: Flags [P.], seq 1855084075:1
E.....@.9....D.c..(
.].Qn.V+.]*....s1......
.....A..GET //admin HTTP/1.1
Host: admin.megacorpone.com:81
User-Agent: Teh Forest Lobster

...
E.....@.@.....(
.D.c.Q.^...E..?I...........
.A......HTTP/1.1 401 Authorization Required
Date: Mon, 22 Apr 2013 12:51:20 GMT
Server: Apache/2.2.20 (Ubuntu)
WWW-Authenticate: Basic realm="Password Protected Area"
Vary: Accept-Encoding
Content-Length: 488
Content-Type: text/html; charset=iso-8859-1

<!DOCTYPE HTML PUBLIC "-//IETF//DTD HTML 2.0//EN">
<html><head>
<title>401 Authorization Required</title>
</head><body>
<h1>Authorization Required</h1>
<p>This server could not verify that you
are authorized to access the document
requested.  Either you supplied the wrong
credentials (e.g., bad password), or your
browser doesn't understand how to supply
the credentials required.</p>
<hr>
<address>Apache/2.2.20 (Ubuntu) Server at admin.megacorpone.com Port 81</address>
</body></html>

...

08:51:25.044432 IP 172.16.40.10.81 > 208.68.234.99.33313:
E..s.m@.@..U..(
.D.c.Q.!o....&......^u.....
.A......HTTP/1.1 301 Moved Permanently
Date: Mon, 22 Apr 2013 12:51:25 GMT
Server: Apache/2.2.20 (Ubuntu)
Location: http://admin.megacorpone.com:81/admin/
Vary: Accept-Encoding
Content-Length: 333
Content-Type: text/html; charset=iso-8859-1

<!DOCTYPE HTML PUBLIC "-//IETF//DTD HTML 2.0//EN">
<html><head>
<title>301 Moved Permanently</title>
</head><body>
<h1>Moved Permanently</h1>
<p>The document has moved <a href="http://admin.megacorpone.com:81/admin/">here</a>.</p>
<hr>
<address>Apache/2.2.20 (Ubuntu) Server at admin.megacorpone.com Port 81</address>
</body></html>
From here, our story becomes clearer. We see a significant amount of failed attempts to authenticate to the /admin directory, which resulted in HTTP 401 replies, while the last attempt to login seems to have succeeded, as the server replied with a HTTP 301 response. It seems someone gained access to one of megacorpone's servers!
No Comments